Profitability · General
Break-Even Analysis: How to Calculate the Sales Level You Need
Break-even shows the sales volume where revenue equals total costs, and what each sale contributes along the way.

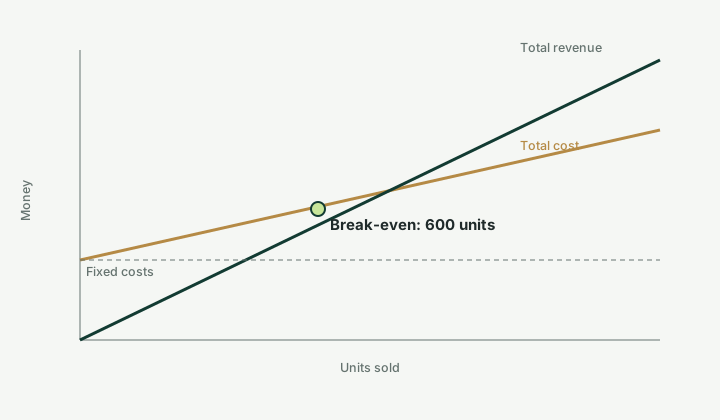
Break-even analysis estimates the level of sales at which total revenue equals total costs. At this point, the business has neither made an operating profit nor an operating loss under the assumptions used.
The formula
For a single product, break-even units = fixed costs ÷ (selling price per unit − variable cost per unit).
A worked example
If monthly fixed costs are $12,000, the selling price is $50 and variable cost is $30, contribution per unit is $20. Break-even volume is 600 units, which is $30,000 of revenue. This example assumes the stated fixed and variable costs are complete and remain stable over the relevant range. Try your own numbers with the break-even calculator.
Contribution per unit
Contribution per unit is the amount each sale contributes toward fixed costs after variable costs. If contribution is zero or negative, selling more units will not solve the problem without changing price or cost structure. The contribution margin calculator shows the same idea as a percentage of revenue.
The limits
Break-even is a planning tool, not a forecast. It does not automatically account for changing demand, product mix, capacity limits, stepped costs, tax, financing costs or the timing of cash receipts. Use scenarios to test different prices, costs and sales volumes, and pair it with a cash flow forecast.
Frequently asked questions
Does break-even include tax?
Not automatically. The simple formula covers operating costs only; tax, financing costs and cash timing need to be added separately.
How do I use it with more than one product?
Use an average contribution based on your expected sales mix, or analyse each product line separately.
Sources
- US Small Business Administration: Calculate your startup costs, US Small Business Administration
- IRS: Small Business and Self-Employed Tax Center, Internal Revenue Service
- US Small Business Administration: Manage your finances, US Small Business Administration
Educational information only, not individual financial, tax, legal or accounting advice. Read the disclaimer.
Discussion (0)
No comments yet. Be the first to add a question or a practical experience.